

Sherkot Demographics 2025: Explore Sherkot Demographics 2025 profile, including its population growth, literacy rates, sex ratio, child population, and social fabric. This article provides detailed demographic statistics for Sherkot, primarily from the 2011 Indian Census. According to some updated estimates, the population will be approximately 88,000 in 2025.
Key demographic indicators include population distribution by gender, literacy rate, sex ratio, child population, caste, religion, and workforce participation.
Sherkot Demographics 2025: Overview
| Category | Value |
| Population (2011) | 62,226 |
| Estimated Population (2025) | 88,000 |
| Male Population (2011) | 32,369 |
| Female Population (2011) | 29,857 |
| Sex Ratio (Females per 1000 Males) (2011) | 922 |
| Child Population 0-6 years (2011) | 9,692 (15.58% of total) |
| Child Sex Ratio (2011) | 888 |
| Literacy Rate (2011) | 68.2% |
| Male Literacy Rate (2011) | 73.29% |
| Female Literacy Rate (2011) | 62.71% |
| Muslim Population (%) (2011) | 74.22% |
| Hindu Population (%) (2011) | 25.07% |
| Scheduled Caste Population (%) | 9.2% |
| Scheduled Tribe Population (%) | 0.01% |
| Workforce Participation (2011) | 29.53% (approx. 18,372 people) |
| Main Workers (%) | 78.25% |
| Number of Wards | 25 |
Sherkot Demographics 2025 and Socio-Economic Profile (2011–2025)
A summary of the key statistics used for the article follows:
- Population (2011): 62,226; Estimated (2025): approx. 88,000.
- Male population (2011): 32,369; Female population (2011): 29,857.
- Average sex ratio (2011): 922 females per 1000 males (state avg 912).
- Child population age 0-6 (2011): 9,692 (15.58% of total).
- Child sex ratio (2011): 888 females per 1000 males (state avg 902).
- Literacy rate (2011): 68.2% (State avg 67.68%).
- Male literacy: 73.29%
- Female literacy: 62.71%
- Religious composition (2011):
- Muslims: 74.22%
- Hindus: 25.07%
- Others: less than 1%
- Workforce engaged in main work: 78.25%
- Sherkot is divided into 25 wards with population and literacy variation.
- Schedule Caste population: ~9.2%; Schedule Tribe: ~0.01%.
Sherkot’s Growing Story: People, Progress, and Patterns
Nestled in the scenic district of Bijnor, the town of Sherkot is more than just a dot on the map — it is a vibrant community with stories etched in its Sherkot Demographics 2025 landscape. As Sherkot continues to grow and evolve, understanding the nuances of its population fabric, literacy strides, and gender balance provides a window into its socio-economic progress. This article delves deep into Sherkot’s demographics of 2025, painting a panoramic picture of its people and their living conditions, highlighting shifts in population, literacy achievements, and gender dynamics.
Population Dynamics: A Town on the Rise
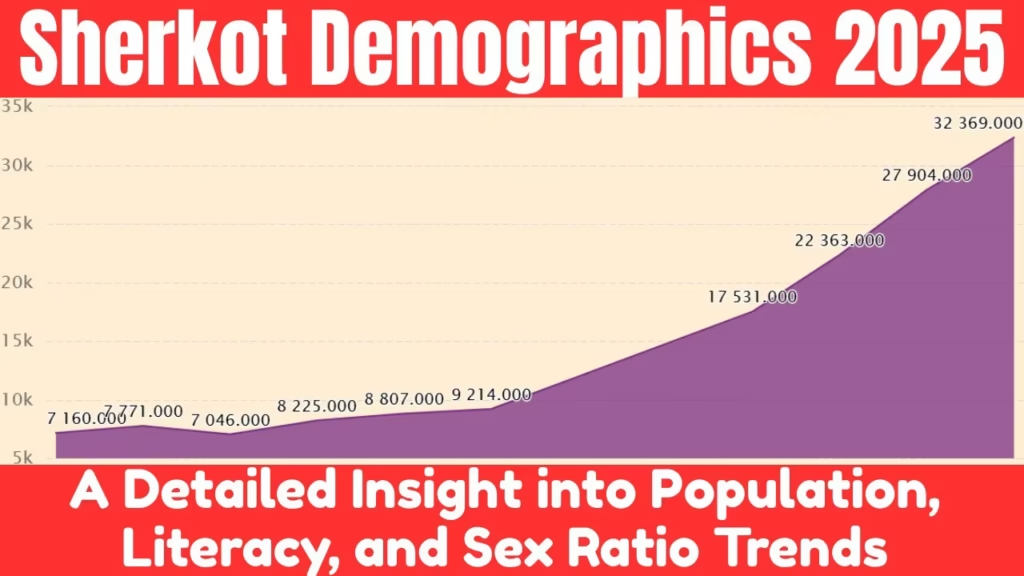
Sherkot’s population has witnessed significant growth since the last official census in 2011. Back then, the town was home to 62,226 residents. Today, estimates for 2025 put the population at approximately 88,000 — a remarkable increase reflective of urban expansion and migration trends in the region. This rise underscores Sherkot’s growing importance as a commercial and cultural hub in Uttar Pradesh.
Male residents accounted for about 52% of the 2011 population (32,369 individuals), while females made up around 48% (29,857 individuals), reflecting a sex ratio of 922 females for every 1,000 males — slightly above the Uttar Pradesh state average of 912, indicating a positive, though still imperfect, gender balance.
Children aged 0 to 6 years form an integral part of this population pyramid, numbering 9,692 in 2011 — nearly 16% of Sherkot’s total population. This youthful base hints at a strong potential for future growth but also reflects the need for adequate educational and healthcare facilities to nurture the next generation.
NPP Sherkot Update 2025: What are the Recent Development Projects in Sherkot by the NPP
BSPHCL Technician Grade 3 Result 2025 Released: Download Scorecard, Merit List at bsphcl.co.in
Literacy Rates: Progress Unfolding, Yet Challenges Remain
Education remains a critical pillar of Sherkot’s socio-economic development, with a literacy rate of 68.2% recorded in the 2011 census. This figure is marginally higher than the Uttar Pradesh average of 67.68%, signaling encouraging progress. However, a closer look reveals a gender gap: male literacy stands at 73.29%, whereas female literacy lags behind at 62.71%.
Bridging this gap is crucial for fostering inclusive growth and ensuring equal opportunities for all. Initiatives aimed at female education, skill development, and awareness can propel Sherkot towards greater equity and empowerment. The town’s administration, overseeing nearly 9,700 households, plays an essential role in facilitating access to schools and learning resources.
Gender Balance: Examining the Sex Ratios
Sherkot’s sex ratio of 922 females per 1,000 males, while better than the state average, still points to persistent challenges in achieving gender parity. The child sex ratio — a critical indicator of societal attitudes towards female children — stands at 888 girls per 1,000 boys, trailing the Uttar Pradesh average of 902.
These disparities may result from socio-cultural preferences and require continued focus on gender sensitization, women’s health, and the enforcement of protective laws to safeguard girl children and women.
Religious and Social Composition: Diversity in Harmony
Sherkot Demographics 2025 tapestry is diverse, with multiple religious communities coexisting peacefully. Muslims constitute the majority population at 74.22%, followed by Hindus at 25.07%. Smaller communities including Christians, Sikhs, Buddhists, and Jains comprise less than one percent in total, enriching the town’s cultural fabric.
Scheduled Castes make up approximately 9.2% of Sherkot’s population, while Scheduled Tribes are a very small presence at 0.01%. This social composition informs the town’s cultural practices, festivals, and community relationships, contributing to its uniqueness within the Bijnor district.
Economic Participation: Work and Livelihoods
Out of the total population, about 18,372 individuals are engaged in work or business activities, with men significantly outnumbering women in the workforce (15,839 males vs. 2,533 females). Around 78.3% of these workers have main employment, while 21.7% are involved in marginal activities.
Most workers are involved in non-agricultural sectors, with a smaller fraction engaged as cultivators or agricultural laborers. This shift towards diversified livelihoods reflects Sherkot’s gradual economic transformation in line with urban development trends.
Sherkot’s Ward-wise Demography: Microcosms of Change
Sherkot is comprised of 25 wards, each with its own population profile, literacy rates, and sex ratios. Some wards exhibit higher literacy rates — such as Ward No. 8 at 68.6% — while others lag behind. Similarly, sex ratios fluctuate across wards, with some approaching parity or even exceeding 1,000 females per 1,000 males, exemplifying pockets of balanced demographics.
This ward-level variation offers insights into localized development challenges and successes, enabling targeted governance interventions for equitable growth.
Dr MGR Medical University Result 2025 OUT: Download UG & PG Marksheet PDF at tnmgrmu.ac.in
DSSSB TGT Recruitment 2025: 5,346 Teacher Vacancies, Application Dates – 9th Oct to 7th Nov 2025
The Road Ahead: Building on Demographic Foundations
Sherkot Demographics 2025 profile encapsulates a town on the cusp of further growth, with a youthful population, improving literacy, and evolving economic patterns. Addressing challenges such as gender disparities in literacy and sex ratio, expanding educational facilities, and promoting inclusive economic participation will be crucial for sustainable progress.
As Sherkot advances towards future censuses and developmental milestones, its people remain the heart of its story — a story of resilience, diversity, and shared aspirations for a better tomorrow.
Conclusion: Sherkot Demographics 2025
This comprehensive Sherkot Demographics 2025 Overview reveals a town marked by growth and transition, with ongoing challenges and promising trends that will shape its future development and social landscape.